Chart Graphs
Advertisement
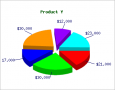
PHP 2D/3D Pie Chart
This PHP script provides a very easy way to embed dynamically generated pie chart and graphs to PHP applications and HTML web pages. The graphing software is very easy to use and it's perfectly possible to add professional quality real time graphing to
Advertisement
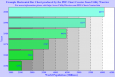
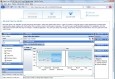
PDF Chart Creator Dynamic Link Library
The PDF Chart Creator Dynamic Link Library is a utility that will create charts from data as a PDF document. The conversion process is fully controlled through the provided Application Programming Interface and the royalty free DLL can be included and
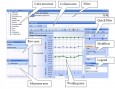
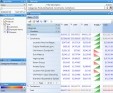
RadarCube OLAP Chart Windows Forms v.2.50.0
NET Windows Forms OLAP controls (both Grid and Chart) to add Visual OLAP Analysis to your applications. Displays business data in charts and graphs rather than in numbers. Works with a relational database or MS Analysis Services.
RadarCube ASP.NET OLAP Chart for MSAS v.2.70.0
ASP.NET and Silverlight OLAP control to add Visual Analysis to your applications. Displays business data on the internet in charts and graphs rather than in numbers. Works with MS Analysis Services OLAP Server. 100% managed code authored in C# 2.0
RadarCube WPF OLAP Grid and Chart v.1.30.0
A set of WPF controls (OLAP Grid and OLAP Chart) to add OLAP and Visual Analysis functionality to your WPF applications. OLAP Grid displays data in an interactive pivot table and OLAP Chart shows the same data in charts and graphs.
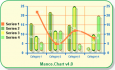
Manco.Chart for .NET v.4 4
Manco.Chart for .NET is a powerful charting component used to create attractive 3D and 2D charts for desktop applications and web pages using .NET technologies. Wide variety of chart types: 40 major chart types are supported,
Infowise Graphs v.1.0.7
Analyze your list data as simple and visually appealing graphs and charts. Infowise Graphs enables users to create a graphic interface to SharePoint lists, and in the current version contains two web parts with the following abilities: 1. Pie Chart:

Make Professional looking graphs with Java 3d Graph Software v.9.0
With 1-2-3 PieCharts you can now quickly and easily create professional looking 3d graphs without any of the usual hassle.

Java Chart Designer
Create professionally looking presentations and reports with Java Chart Designer. Feature rich and powerful application gives you full power to create outstanding report and presentation projects. A user-friendly interface, great number of visual effects
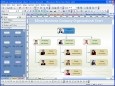
Edraw Organizational Chart v.7.8
Edraw is a new organization chart drawing software, which creates organisation charts and business charts with minimum time loss for you. Support basic flowcharts, organizational charts, business charts, hr diagram and work flowchart.

Dragonfly Chart .Net
.Net Window Form Chart Components including DAS_Net_PieChart, DAS_Net_FlatPieChart, DAS_Net_3DPieChart, DAS_Net_BarChart, DAS_Net_FlatBarChart, DAS_Net_XYChart and DAS_Net_AngularChart and others provide powerful chart functionalities which can meet